
The below image shows the design layout of R2 Reports.
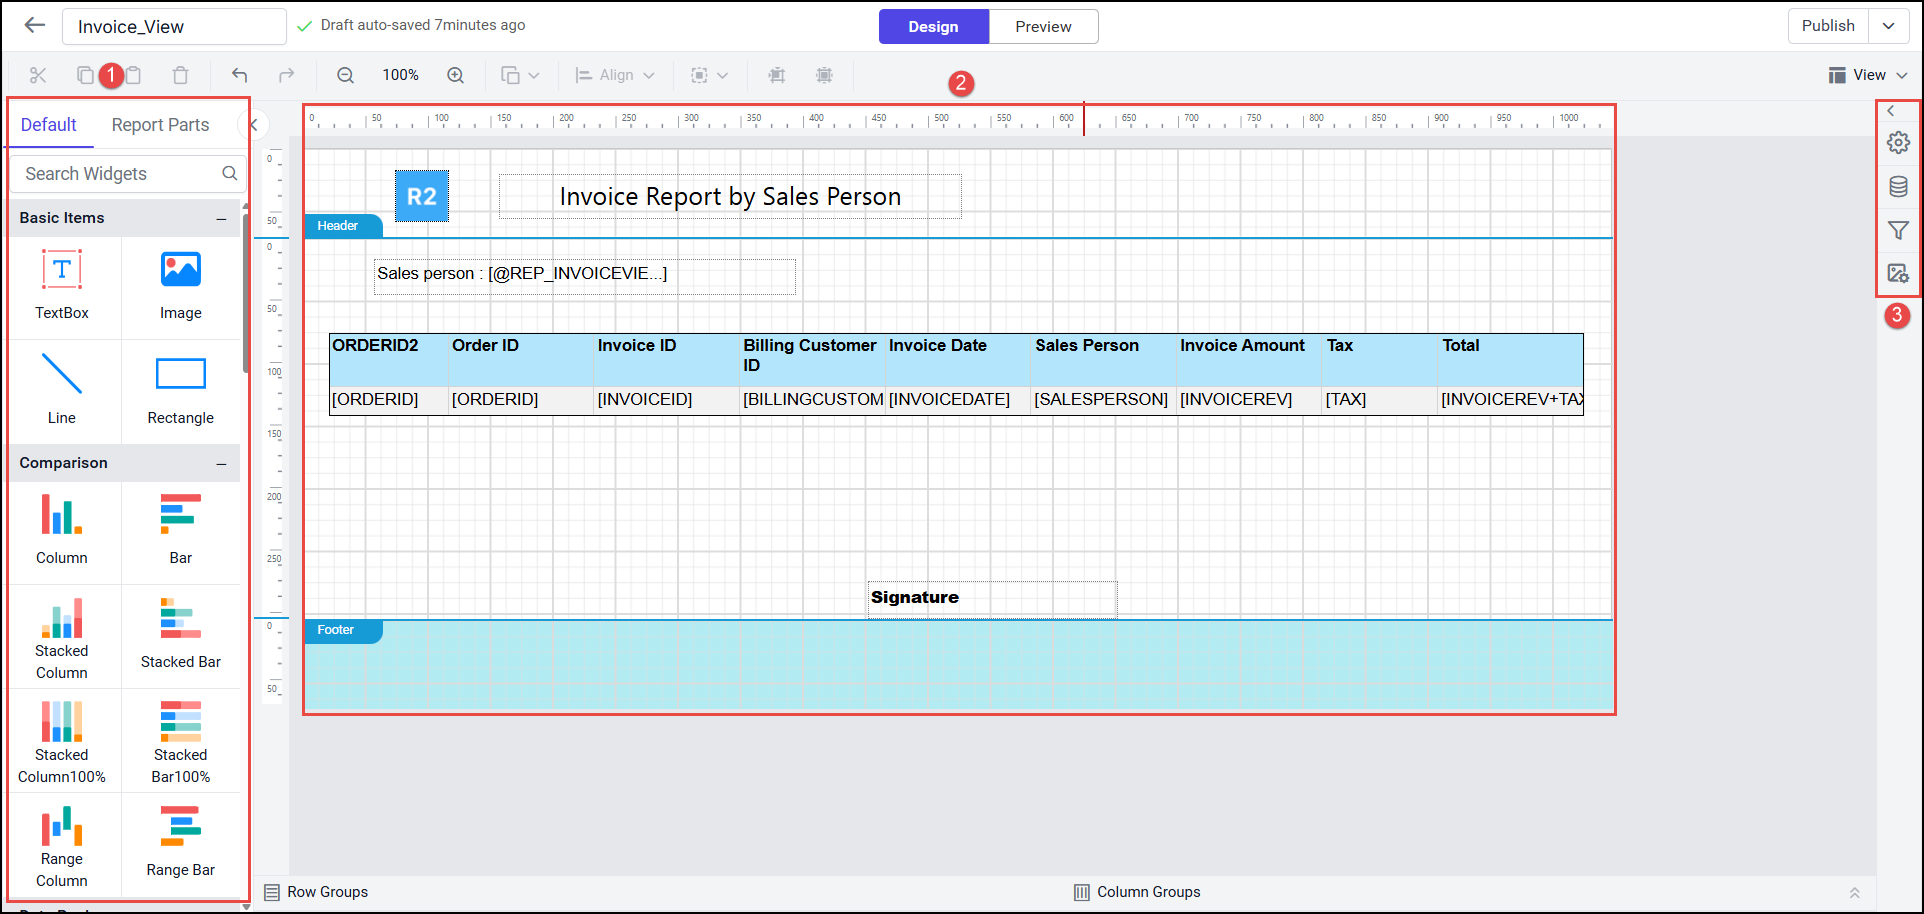


Steps to design Layout
-
Select the View item under Default in the widget panel, then drag and drop it to the design area.
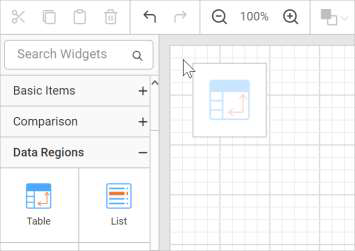
-
The above action will render the Table with two rows and three columns in the design area, you can add more by doing right click.
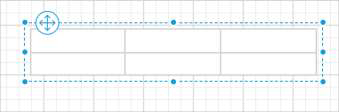
-
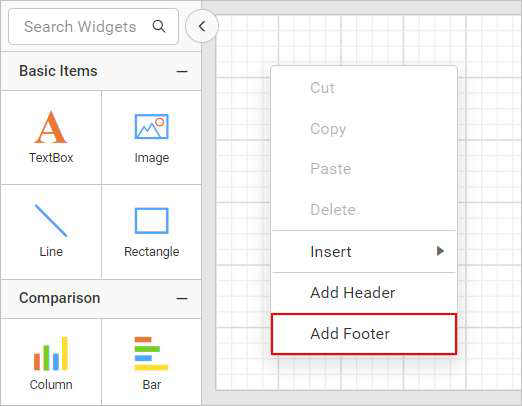
Like wise, you can add Header and Add Footer to your report.
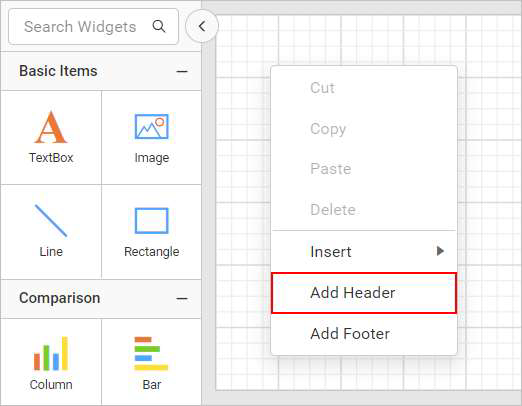
-
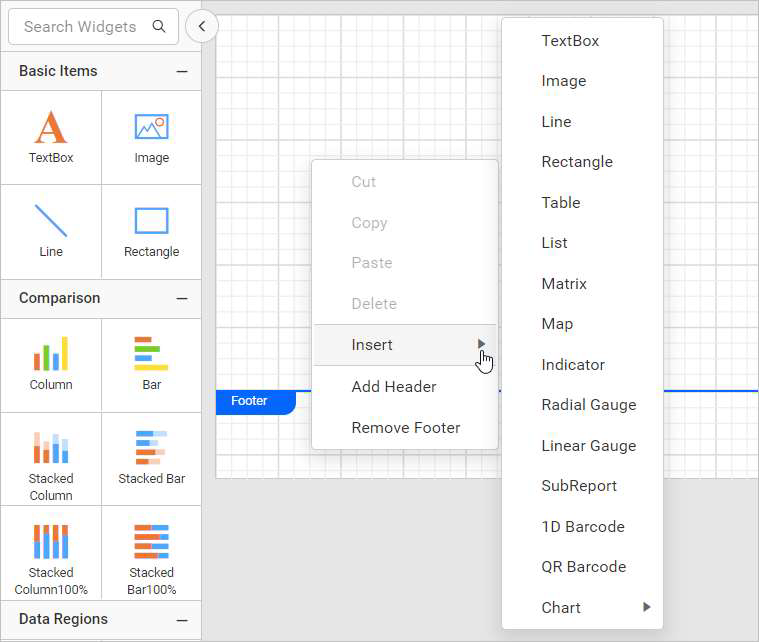
To Insert item at design surface:
-
Right click/Drag and Drop item on the design surface.
-
Based on the target surface (body, footer, or header), the context menu will show the report items list in the Insert option.
-
-
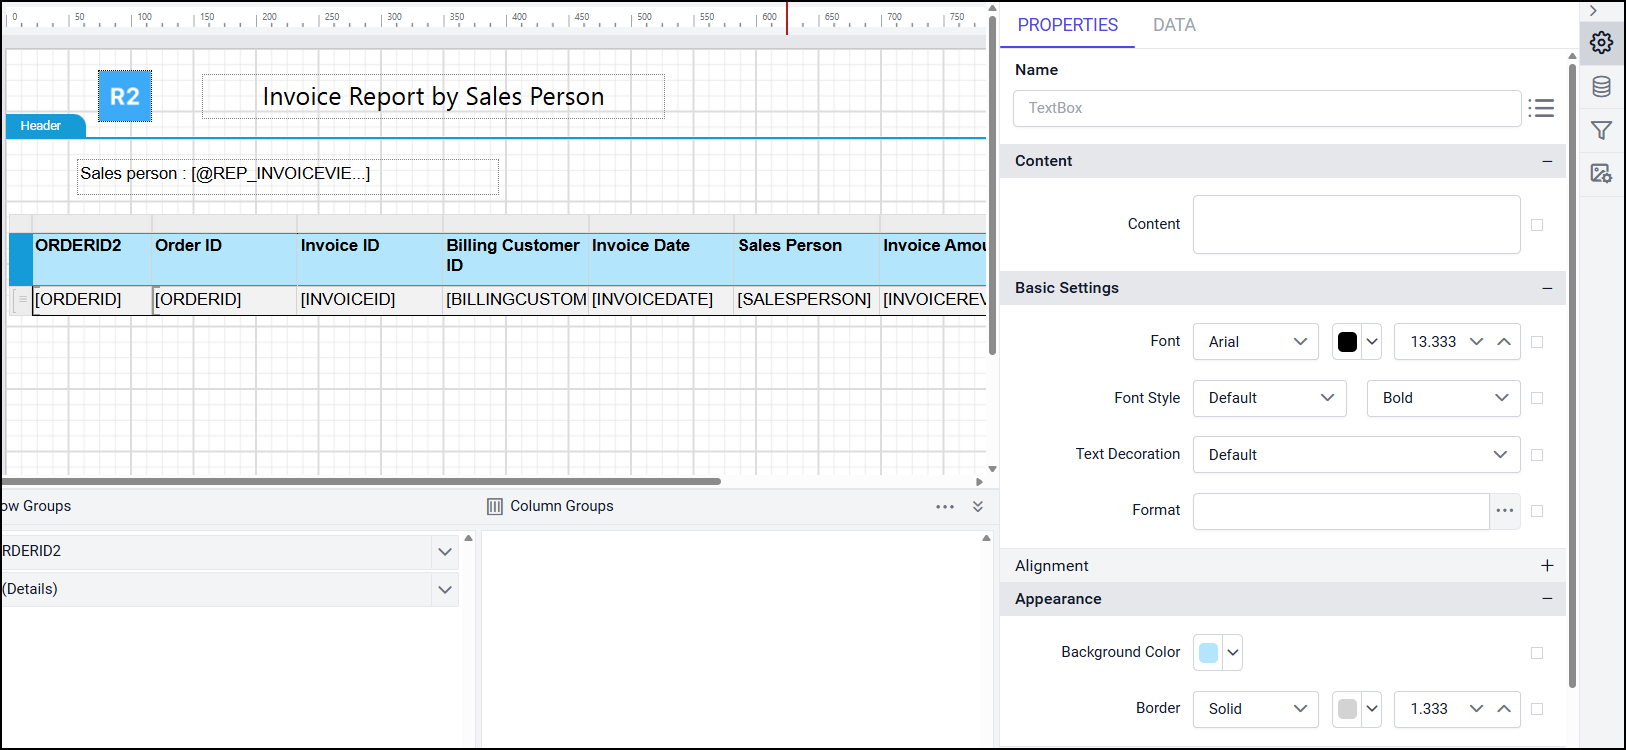
You can add Table and set properties as follows
-
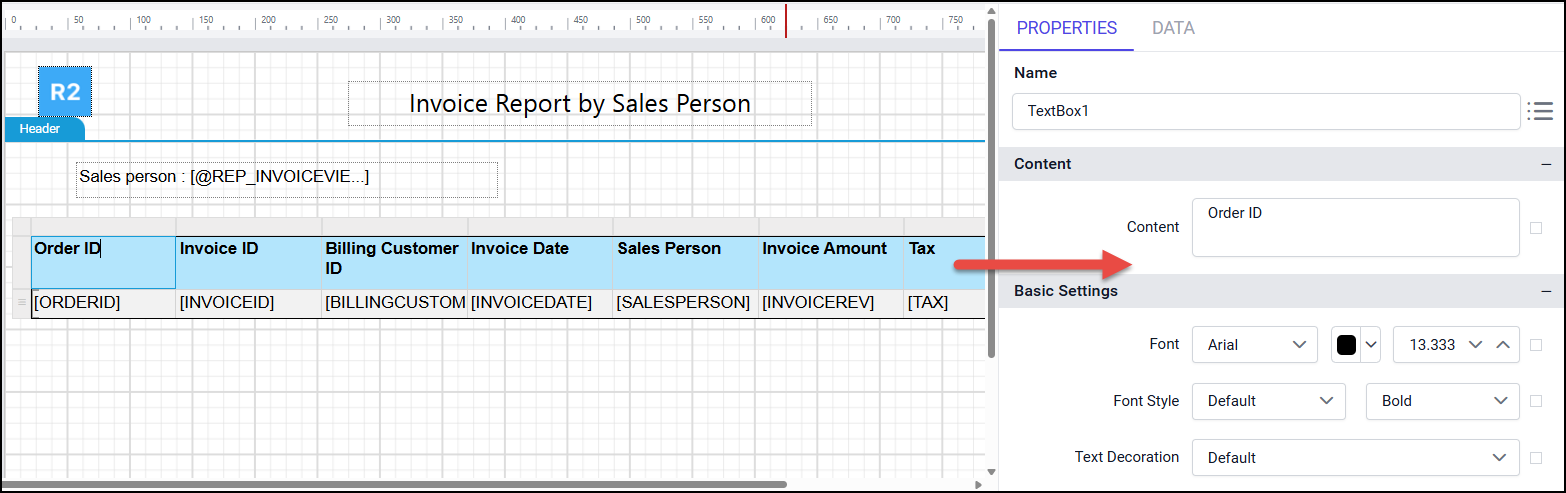
You can add Text properties as follows
Assign data fields in Table cell
-
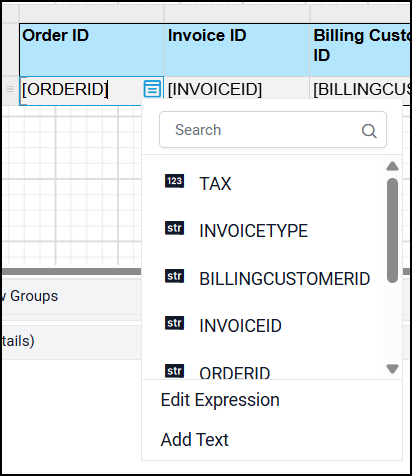
Select the Table cell and click on the Data assign menu icon to assign data.
-
Select the value field in the Table cell.
-
Similarly, you can assign the required data fields to all the cells.
Add expression to the cell
You can assign expression to the cells such as Addition, Subtract or any other expressions to get any result from the columns required.
-
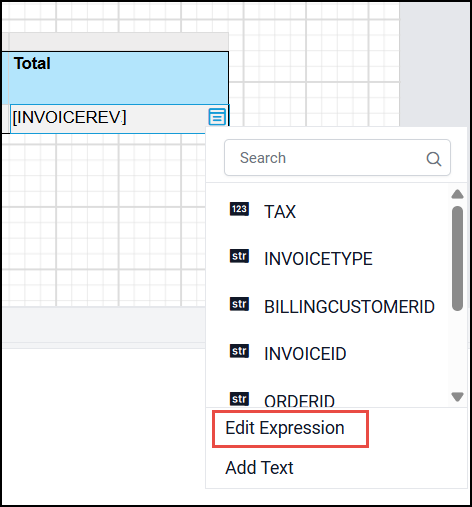
Click on any cell to add expression and do right click.
-
Click the Edit expression dialog,
-
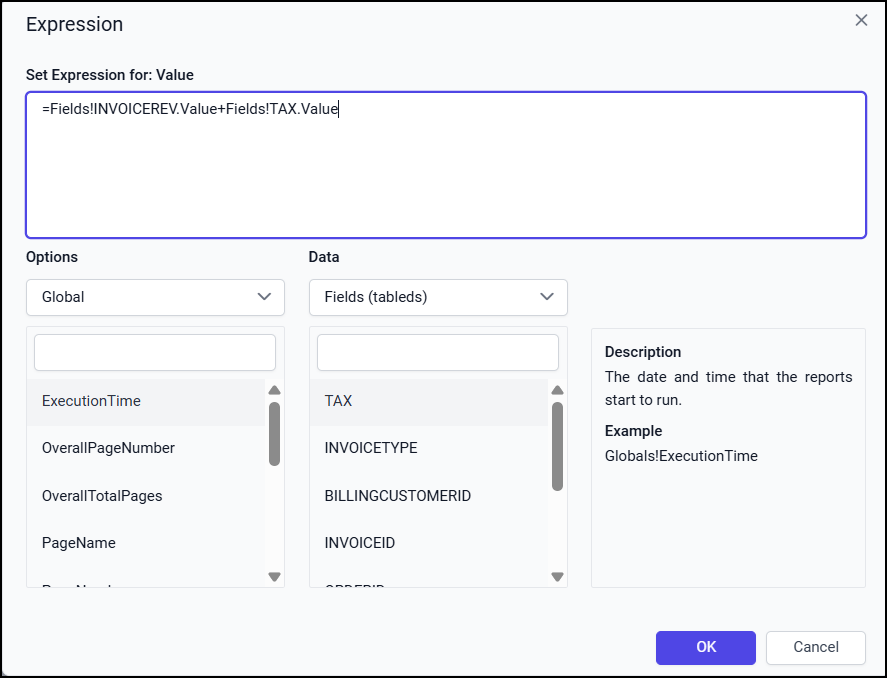
Add the following expression to add two column values(Ex: Invoice Revenue+Tax) and click OK.
=Fields!INVOICEREV.Value+Fields!TAX.Value
-
-
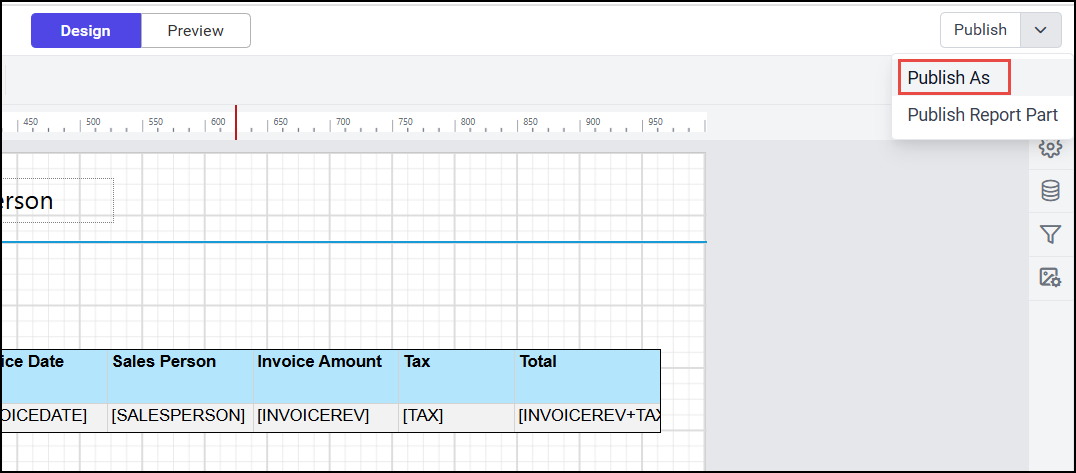
Now, the View will look like below

similarly you can use any kind of expressions according to the result you need.
Publish the report
You can publish the report to save it for future reference.
-
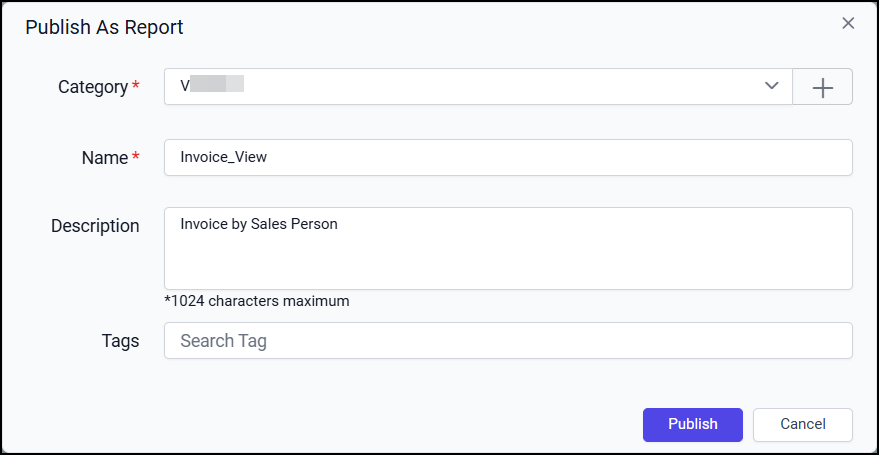
Enter the following fields.
-
Select category from dropdown(Sample reports/User name).
-
Enter Report name.
-
Enter Description
-
You can add Tags name
-
-
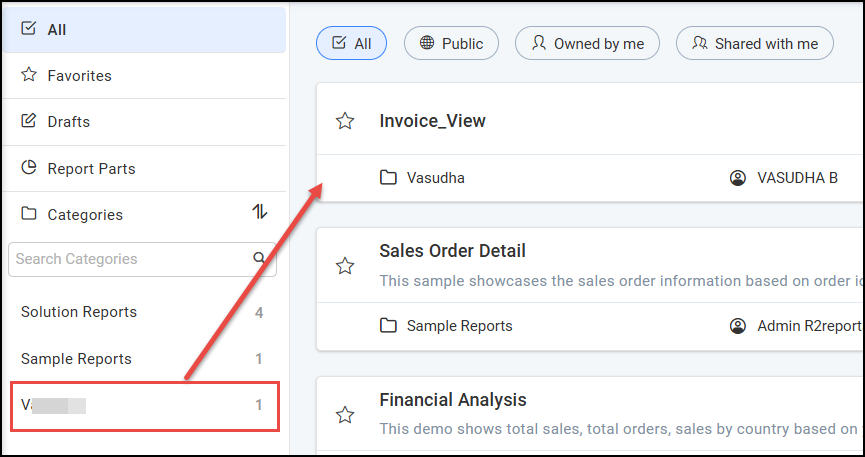
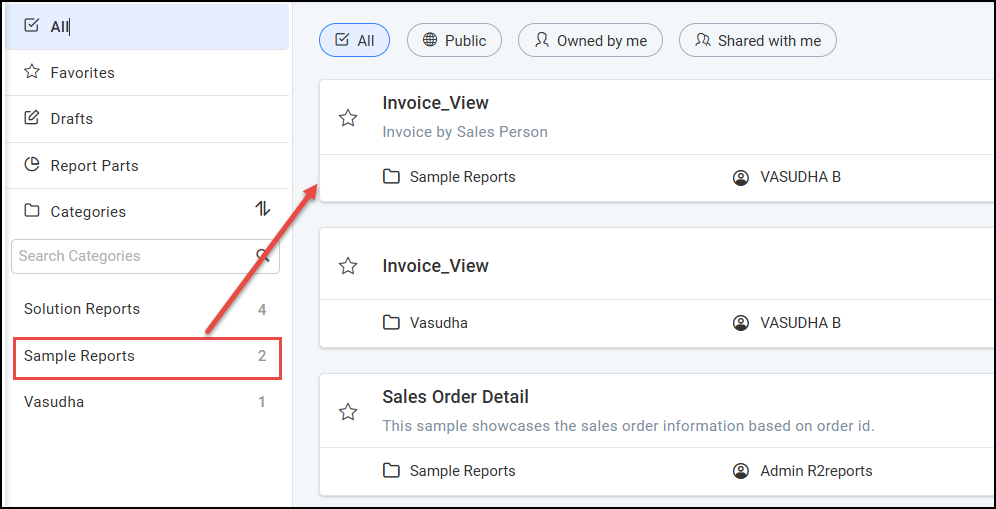
You will see the report in quick access section from the category you have selected.
You can customize the report as required.
-
Click here to know how to add image?
-
Click here to know how to Merge cells?
-
Click here to know how to group the categories?